| Wählen Sie die deutsche Sprache |
| Wählen Sie die deutsche Sprache |
The Gall - Peters misapprehension
written and translated by Jürgen Heyn
In
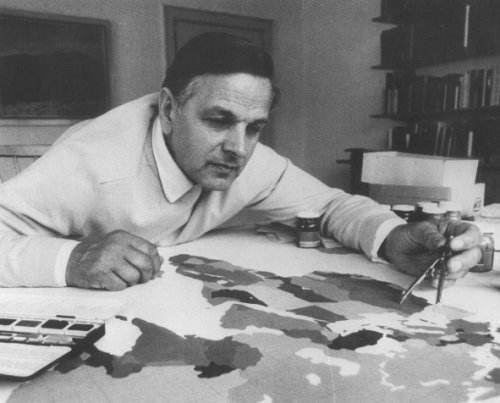
commemoration of Prof. Dr. Arno Peters born May 22nd, 1916 in Berlin died
December 2nd, 2002 in Bremen.
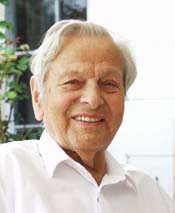 |
For my personal interest in the Peters-Map I was allowed to visit Prof. Dr. Arno Peters three times in the past years in home in Bremen. When I met him he was a friendly senior gentlemen with bright eyes and a agile spirit. |
I was especially interested in the principles of the construction of the Peters-Map and why this map didn't become widely accepted. Prof. Dr. Arno Peters answered all my questions full and frank. The time I was able to spend with him were very informative and enjoyable, meeting him left a lasting impression on me. The notice of his death touched me emotionally. My deep sympathy is with his family. No one is really dead as long as somebody remembers him. Prof. Dr. Arno Peters leaves with his “Peters-Map” a part of lifework which will be remembered generations after him.
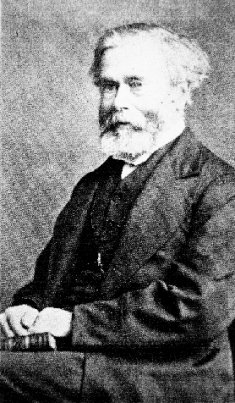
I have already described the method of construction of the Peters-Map extensively. On the question "Why didn't get the Peters-Map widely accepted", Prof. Dr. Arno Peters expounded me the hostilities (example 1, example 2) against his person and against the Peters-Map designed by him. It is reserved to others to write a commentary on the reproach of the political propaganda. With the following explanations I would like to refute the reproach that he had taken over the idea for his map from Rev. James Gall and even claimed fame and honor for himself.
|
Even among the experts the mistaken belief predominates, the world maps of Rev. James Gall and Prof. Dr. Arno Peter are identical. This is a fallacy even if the appearance of both maps resembles itself to confusing. |
|||||||||||||
Gall's Orthographic Projection
|
Peters Decimal Map
|
||||||||||||
 |
 |
||||||||||||
|
|
|
||||||||||||
Already
in 1958 Arno Peters has succeeded to represent the simultaneity of historical
events graphically, in his "Syncronoptical World-History". He
intended to illustrate this work with maps in an atlas. Here
as well the equivalence was extremely important to him.
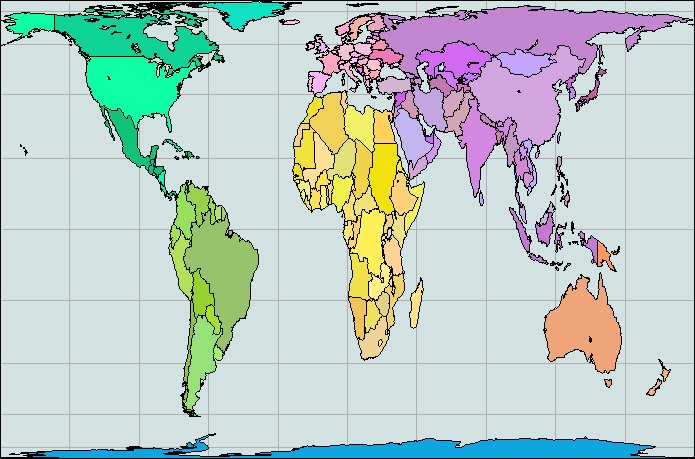
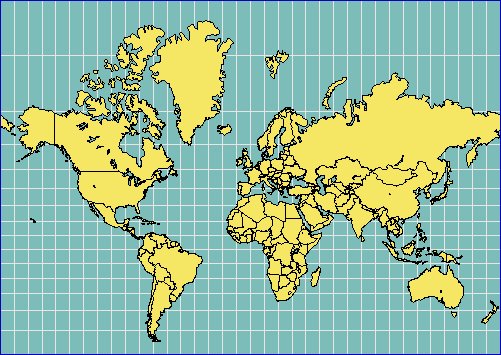
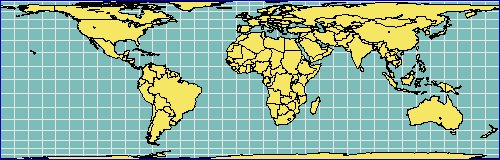
Under this point of view, he evaluated the most current maps. He
discarded the simple cylindrical (Plate Carree) and the normal aspect of the
Mercatorprojection because the countries of the world can not be represented
equivalent (equal-area).
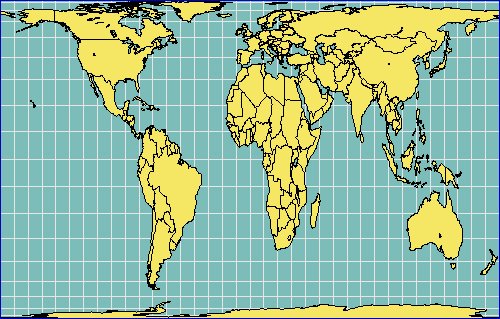
Simple cylindrical projection (Plate Carree)
|
||||||
|
Mercator Projection (normal aspect)
|
||||||||
|
Sinusodial Projection
|
||||||
|
Arno
Peter also discarded all world-maps with
curved longitudes. Although
there are equal-area projections available, the north-south alignment at the
edges of the map is distorted in a manner which was not acceptable for him. By
extensive investigations, Arno Peters recognized that the rectangularly-ness of a world map was more important
to the people than all other map qualities like for example the equal area or
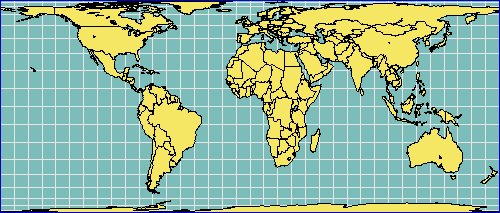
conformal projections. He
knew about the rectangular, equal-area map of
Heinrich Lambert of the year 1772 and of Walter Behrmann introduced in
Berlin 1910.
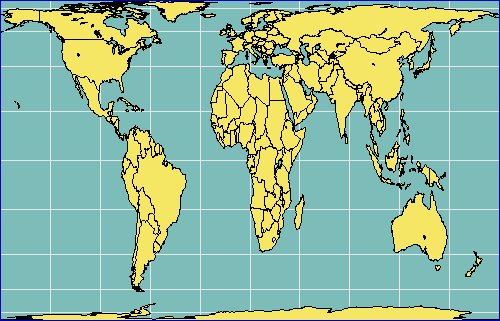
Lambert equal-area cylindrical
projection
|
||||||
|
Behrmann equal-area
cylindrical projection
|
||||||
|
But also these world maps didn't fill the requests, that Arno Peter had put for his purposes. Central Europe, Canada and Russia are vertically compressed too much.
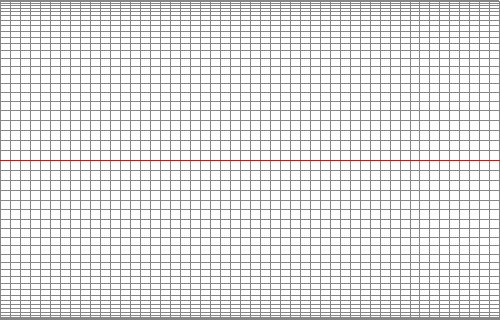
So Arno Peters decided to develop his own map. He applied the following basic principle to it: For the development of an equal-area map, the starting value must be a known area. For his first attempts, he used the ellipsoid-table of Bessel 1841, in which the areas are stated from each 1° in longitude to 1° in latitude. As a not-mathematician, he approached the problem graphically by drawing a horizontal line of 100 cm in length which represented the equator. He decided to develop his grid in the metric system by drawing 100 by 100 rectangles; so he drew 100 squares along the equator representing 3.6° in longitude (circumference 360° divided by 100) and 1.8° in latitude (1/2 circle of longitude 180° divided by 100) because there a twice as much longitudes than latitudes. He placed his vertical zero (left edge of the map) through the Bering Sea (168.6° W). Consequently the North American mainland is in the left half while the entire Asian mainland is on the right half of the map.
For the calculation of the area, he applied the following approximation-formula:
|
The
reference ellipsoid Friedrich Wilhelm Bessel 1941 |
|||
|
semi-major
axis |
a |
|
6377,397155
km |
|
semi-minor |
b |
|
6356,07896325
km |
|
flattening |
f |
(a
- b) / a |
0,003342773 |
|
|
|
1
/ f |
299,1528189 |
|
numeric eccentricity |
e |
Wurzel(1
- (1- f)^2) |
0,08169683 |
![]()
With this formula Arno Peters calculated 50 areas of the northern hemisphere.
|
|
He
determined the length of one side of the square (which lays on the equator) by
extracting the square root of the first area. He
called this square “basic grid mesh”; the length of one side
"baseline". In order to develop a rectangular map all following
vertical rectangles must have the same width. Because the areas decrease with
increasing latitudes the height of the rectangles have to decrease as well. He
managed this by dividing each area by the baseline. To get the height of the rectangles
on his map from the height of the grid meshes he computed a scale factor (width
of the basic mesh on his map divided by the baseline (1 / 282,37 = 0,003541)). By
fundamental operations of arithmetics he calculated the height of every
rectangle according to the desired width of the map.
|
|
||||||||||||||||||||||||||||||||||||||||||||||||||||||||||||||||||||||||||||||||||||||||||||||||||||||||||||||||||||||||||||||||||||||||||||||||||||||||||||||||||||||||||||||||||||||||||||||||||||||||||||||||||||||||||||||||||||||||||||||||||||||||||||||||||||||||||||||
By reflection around the equator Arno Peters retrieved the rectangles for the southern hemisphere.
Peters decimal grid |
 |
To enter any geographic coordinates into his grid Arno Peters calculated the area between the equator (0°) and the desired geographic latitude using the approximation-formula. The result divided by the baseline and corrected to the scale of the map gives the height from the equator.
Peters decimal map |
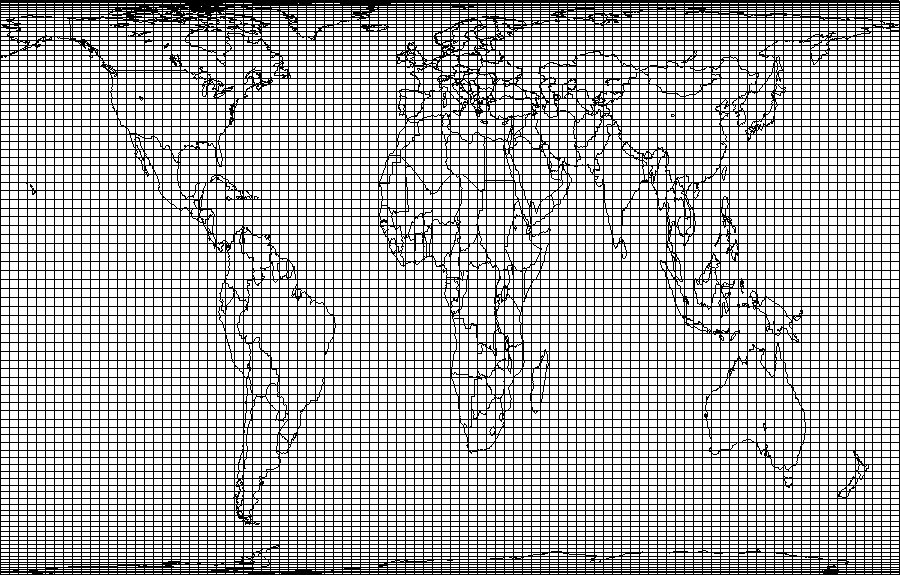 |
Arno
Peters was content with his world map. The northern (and southern) countries are
well recognizable. The
distortion of shape is within acceptable limits. Even
the vertical distortion of the equatorial countries is not that bad, as if these
countries could not be recognized.
In
a lecture given to the geographical class of the university of science in
Budapest, Hungary on 6th October 1967, he introduced his new world
map and explained the geometrically method of construction.
If
the competent public would have noticed the similarity of the map with the
projection of Rev. James Gall, Arno Peters would have been exposed as an
impostor at this point.
In the years to come Arno Peters was getting to have doubts and started to experiment with several cylindrical projections. The initial formula was the one of Walter Behrmann (standard parallel at 30° N/S).
x = Lambda
* Cos(30°) y = Sin(Phi) /
Cos(30°)
(Remark: The spatial object is a sphere)
First
he projected 5 maps with the standard parallel at 35°, 40°, 45°, 50° and 55°
N/S. He
came to the conclusion that the best projection must be somewhere between 40°
and 50° N/S.
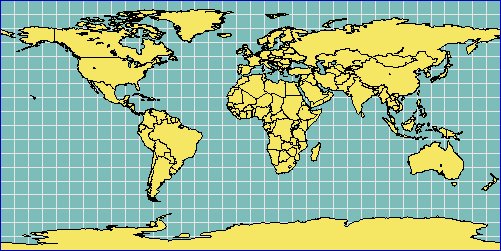
He continued and projected 8
additional maps with a difference in latitude of 1° and the result was that the
best projection is the one with the standard parallel at 45° N/S.
|
If
Arno Peters would have known the projection of Rev. James Gall at that time he
could have saved a lot of work. Why
should he had done so extensive and time-consuming experiments which somebody
else did long before him with exactly the same result?
He introduced the results of his studies in a lecture given to the German Cartographical Society in Berlin on 30th October 1974. Concerning his geometrical grid he expresses:
If the shrewd specialists would have had any idea of the projection of Rev. James Gall, Arno Peters would have received scorn and mockery. But he didn't, in spite all media appreciated his "new” world map.
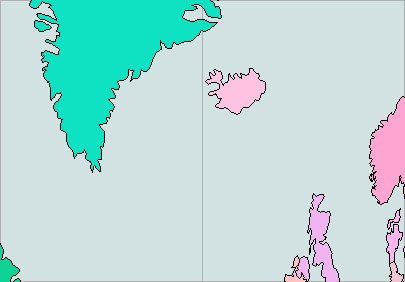
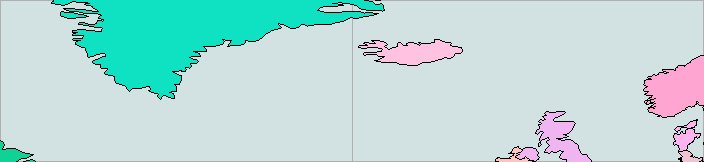
Arno Peters was definitely aware that the polar regions are unreasonably distorted on his world map. He therefore suggested for the construction of sectional maps the following method. From the bounding latitudes the geometrical average is calculated which will be the new reference line.
|
For a sectional map of Iceland the
southern latitude of 54°N and for the northern latitude 72°N might
be selected. |
||||||||||||||||||||||||||||||||||||||||||||||||||||||||||||||||||||||
|
||||||||||||||||||||||||||||||||||||||||||||||||||||||||||||||||||||||
|
Baseline = 182,159422 km
(Island is displayed almost true in shape but in any case equal-area) |
||||||||||||||||||||||||||||||||||||||||||||||||||||||||||||||||||||||
|
Baselinie = 282,370542 km
(Island is displayed equal-area but very distorted in shape) |
||||||||||||||||||||||||||||||||||||||||||||||||||||||||||||||||||||||
| Remark: This principle is used for the sectional map published in the Peters-Atlas. | ||||||||||||||||||||||||||||||||||||||||||||||||||||||||||||||||||||||
It
would be very interesting for me to know at what time the similarity of the
Peters-Map and the projection of Rev. James Gall was recognized first. It
seems to me that the critics never really looked at the method of construction
of the Peters-Map. Otherwise
I can’t imagine that one declares the method of construction of the Peters-Map
as a simple “modification” of already known cylindrical projections. I
don’t want to comment whether the method of construction of Arno Peters is
“revolutionary” new. In
fact I don’t know any other map which is created in a nearly similar
geometrical construction.
Equal-area cylindrical projection (Standard parallel 45° N/S) |
|
 |
 |
Animation |
Animation |
|
|
Quotation: "I have wondered why geographers never thought of using the
Isographic projection with the latitudes rectified at the 45th parallel."
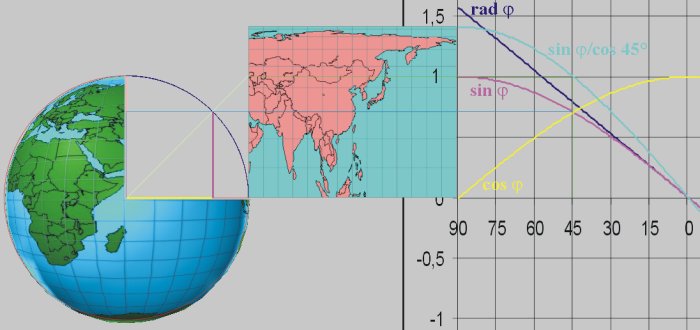
An angle of 45° in the standard circle (r = 1) divides a square into two equilateral triangles. Because of this the Sin(45°) = Cos(45°) and the result of the division Sin(45°) / Cos(45°) = 1. A rectangle at 45° with the length of the sides 2 * 1° of longitude (2 * Cos(45°) ) and 1° of latitude (1 * Sin(45°)) has the area of 1,414213 * 0,707106 = 1. The same rectangle at the equator has the area of 2 * 1 = 2. The square root of 2 = 1,414213. An area of 1 divided by 1,414213 = 0,707106 (= Sin(45°) = Cos(45°)).
|
|
|
|
|
For his construction Arno Peters assumes the earth as an ellipsoid and he develops his grid geometrically on the basis of area computations. The latitude of no distortion (standard-parallel) results from the method of construction and varies with the selected ellipsoid. |
The
world maps of Arno Peters and Rev. James Gall are very similar but they are not
identical. A
Peters-Map can only be such which has been designed using his method of
construction. Any
other map which has not been designed using Arno Peters method of
construction can never be a Peters-Map.
To project a map with the dimensions of the Peters-Map the formula for the equal-area cylindrical projection of an ellipsoid has to be used:
k = Cos(Phi0)
/ SQRT((1 - e^2 * Sin(Phi0)^2))
q = (1 - e ^ 2) * (Sin(Phi) / (1 -
e ^ 2 * Sin(Phi) ^ 2) - (1 / (2 *
e)) * Log((1 - e *
Sin(Phi)) / (1 + e *
Sin(Phi))))
(Remark.: Log is the natural logarithms with the base e =
2.718281...)
x = a * Lambda
* k
y = a * q / (2 * k)
To design a Gall's Orthographic Projection using the geometrical method of Arno Peters the areas of the surface of a sphere have to be computed.
M = 2 * Pi * r * h
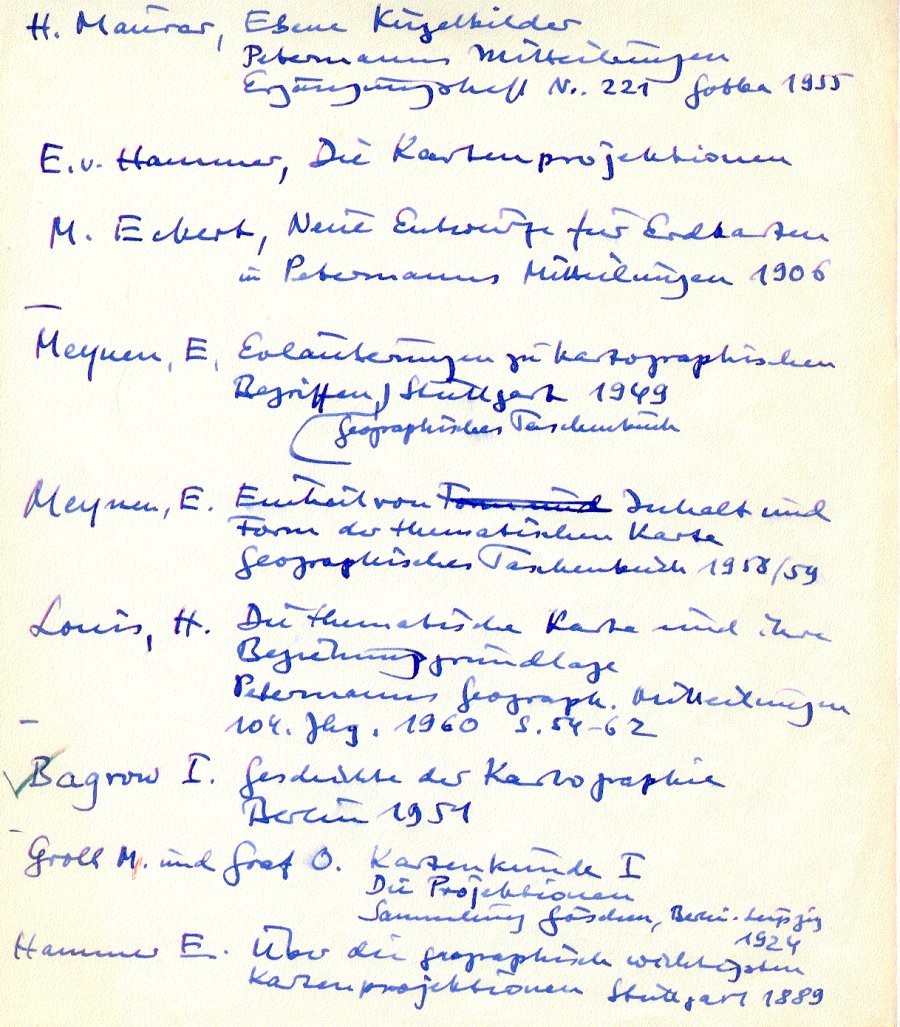
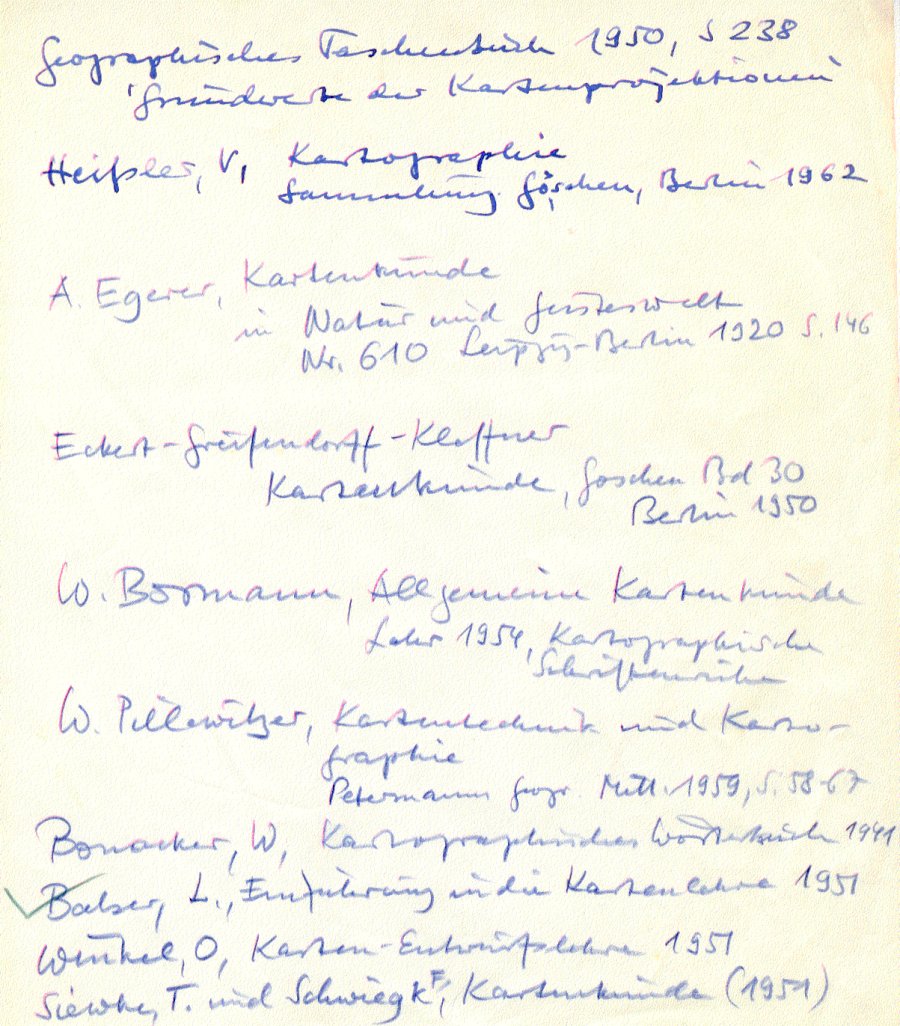
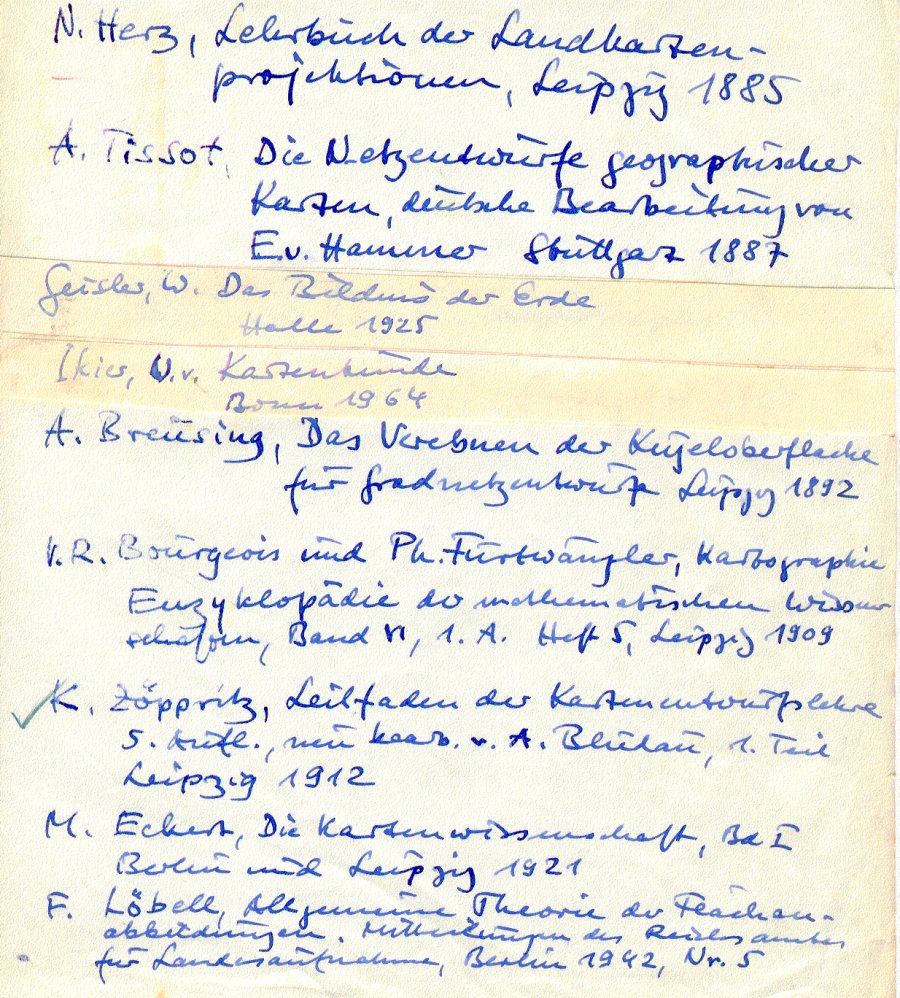
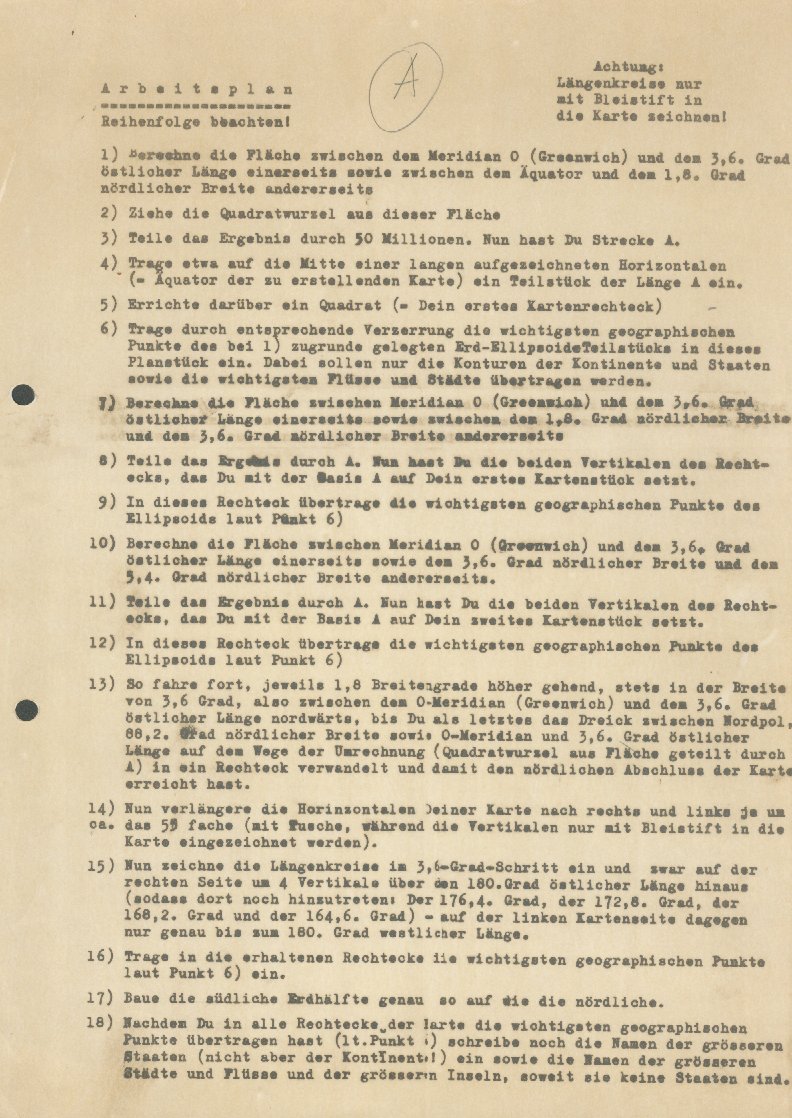
Conclusion: Arno Peters gave me his records which he had made at that time. Among others a handwritten list of sources (page 1, page 2, page 3) which he had studied very closely when he started to deal with the subjects of geography and cartography. Also a guide (page 1, page 2) to design the Peters-Map which he has created for school class in April 1967.
I
checked the sources as they were available and accessible to me. In
only one book: "Die Kartenwissenschaft" Band 1 [Forschungen und
Grundlagen zu einer Kartographie als Wissenschaft] von Max Eckert, Berlin und
Leipzig 1921, I found a reference to Rev. James Gall.
Page 116 quotation (translated): "As far as the english cartographic
literatur is known to me, I have noted only poor approaches to enter independet
ways of projection theories, in fact when dealing with older cylindrical
projections or modifications of the Mercatorprojection (Gall)."
Page
173 quotation (translated): "Batholomew, who was not uncritical against
the Mercatorprojection managed this in the Challangerwerk and in other
publication by using another projection which is called "Galls
Stereographic Projection"."
Both
statements associate Rev. James Gall directly with the Mercatorprojection which has been
discarded by Arno Peters due to the missing equal-area property.
Arno Peters never defended himself against the accusation. May be his rival declared this as a confession of blame.
The
claim that the "Gall's Orthographic Projection" and the Peters-Map are
identical is untenable and
groundless. For the purpose
of a general display of all countries of the world on one global map I prefer
and suggest the "Peters-Map"
|
|
Please report all broken LINKS, thank you.
This is a private homepage with absolutely no commercial
intentions.
Copyright © Jürgen Heyn 2001, All rights reserved
Date of last amendment: 10. Juli 2003